

Key Takeaway
Learn how to calculate customer lifetime value, separate revenue from margin, compare LTV with CAC, and use real local-business data.
A cheap lead can still be an expensive mistake. A pricier lead may be money well spent, but only when the customer relationship produces enough verified margin over time. The first invoice tells you one part of that story, not the ending.
For a repeat-service business, start with this calculation:
Revenue LTV = average completed-job value × completed jobs per period × average active periods
Keep every input in the same period. If you measure jobs per year, measure the relationship in years too. This answer is revenue, not profit. Before you use it for a marketing or profitability decision, calculate a second figure using gross margin and compare customer acquisition cost separately.
The multiplication is the easy part. A result you can trust depends on how you define a customer, what you call "active," how well you clean the records, and whether you label the answer honestly.
What customer lifetime value means
Customer lifetime value, usually shortened to LTV or CLV, is the value a customer generates across the relationship with your business. Sometimes it describes value you have already measured. Sometimes it estimates value you expect to receive.
That distinction matters. Three years of completed invoices gives a local business evidence of realized value. A three-year forecast built from six months of customer data is still an assumption. Both can be useful. They should not get equal weight in a budget decision.
"Lifetime" sounds grander than it needs to. It can mean a fixed observation window, such as the first 12 or 24 months after acquisition. It can also mean the period when a customer meets your definition of active.
The word "value" also needs a label:
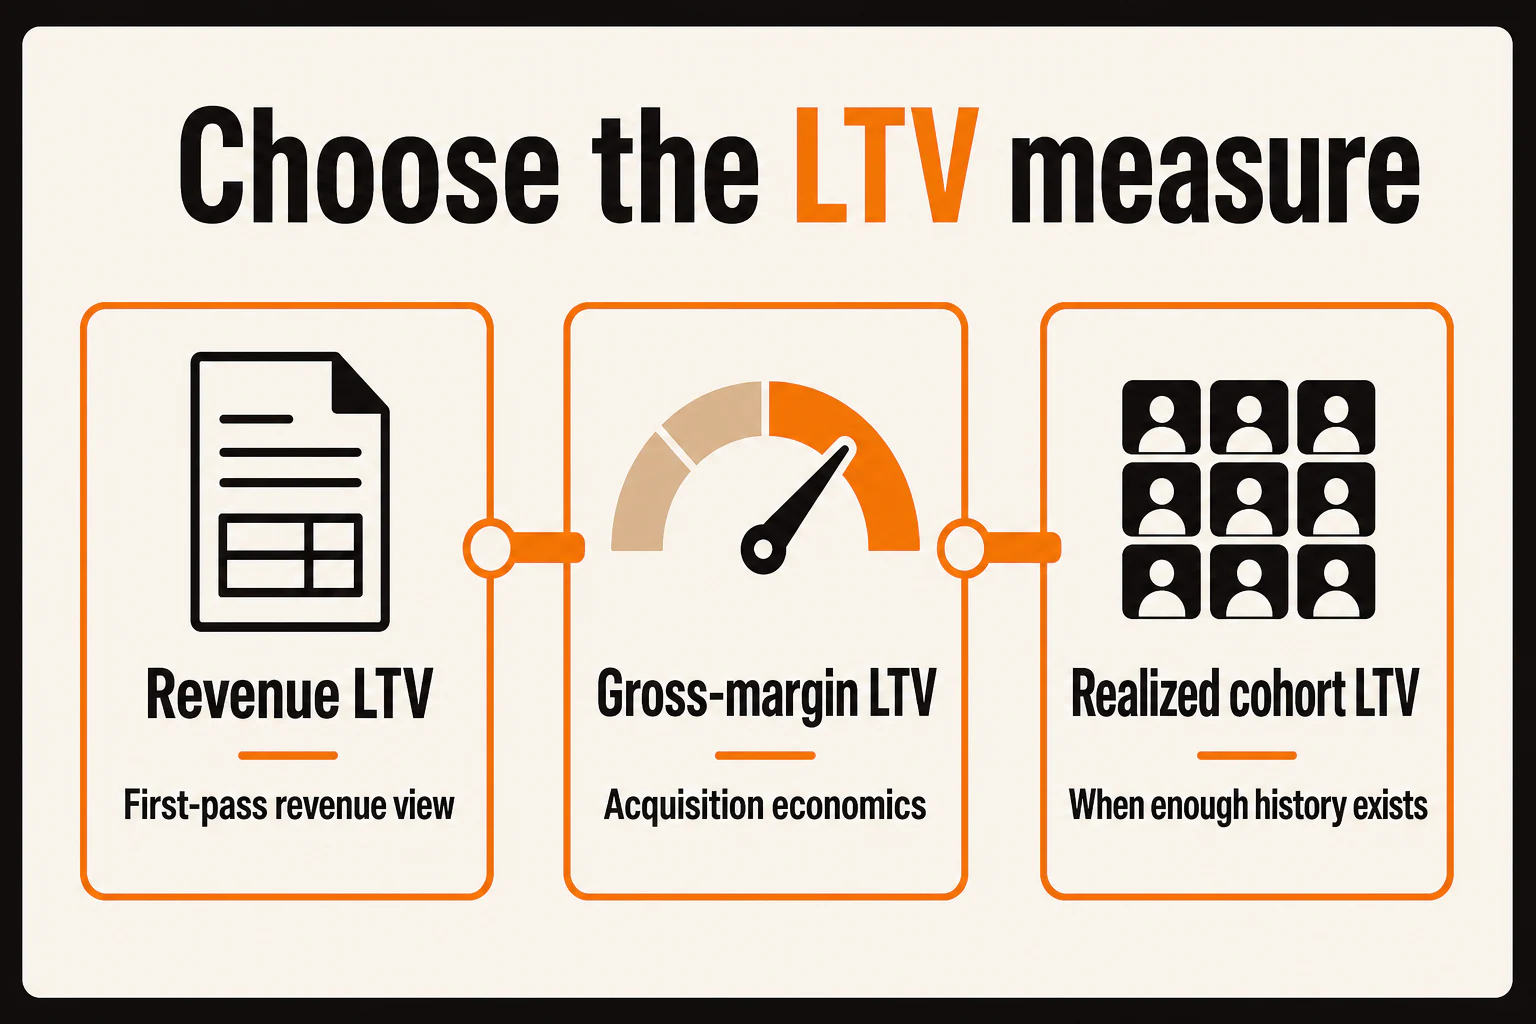
- Revenue LTV adds the revenue associated with the customer. It does not account for the cost of delivering the work.
- Gross-margin LTV applies the business's gross-margin rate to revenue LTV. It accounts for the direct costs included in that margin calculation, but it is not automatically net profit.
- Contribution-margin LTV subtracts the variable costs included in the business's contribution-margin definition. Do not use this label unless the underlying cost data supports it.
The basic transaction formula is a practical starting point, not a universal accounting standard. Stripe describes the same core relationship using average transaction value, transaction frequency, and customer lifespan. Again, the multiplication will not trip you up. Mismatched inputs will. Make sure every input describes the same customers over the same period.
Choose the LTV formula that fits your business
An HVAC company is not a subscription software business, however tidy that formula looks in a spreadsheet. A repeat-purchase formula is just as misleading for a project business where most customers buy once. Use the model that fits how your customers actually pay you and the quality of data you actually have.
| Business or data situation | Formula or method | What the result represents | Main caution |
|---|---|---|---|
| Repeat service or transaction business | Average completed-job value × jobs per period × active periods | Revenue LTV | A weak lifespan estimate can make the forecast look more certain than it is |
| Margin-aware acquisition analysis | Revenue LTV × gross-margin rate | Gross-margin LTV | It excludes CAC and any overhead not included in gross margin |
| True recurring-revenue business | ARPA × gross-margin rate ÷ churn rate | Simplified steady-state gross-margin estimate | ARPA and churn must use the same period; it is a poor fit for irregular local services |
| Business with enough customer history | Total realized revenue or margin for a cohort ÷ customers acquired in that cohort | Historical or cohort LTV for a fixed horizon | Results depend on clean customer matching and a defined cohort window |
ARPA means average revenue per account. Churn is the share of recurring revenue lost during a defined period. That subscription shortcut assumes ARPA, gross margin, and churn stay reasonably stable. It can work for a genuine monthly membership or recurring contract. Customer optimism, on its own, is not a recurring-revenue model.
For many local businesses, three moves are enough to start:
- Calculate revenue LTV to understand the size of the relationship.
- Apply gross margin before using LTV to judge acquisition economics.
- Compare the forecast with realized value from an actual customer cohort as the data matures.
More advanced cash-flow models exist. Most owners do not need one for this first calculation.
How to calculate customer lifetime value in four steps
You can build a useful first estimate without buying a specialized LTV platform. You need a consistent definition and records that connect completed work to an identifiable customer.
1. Define the customer and the observation window
Start by deciding what one customer means in your business. It might be an individual patient, a household, a commercial account, a property, a location, or a company. This detail can feel fussy until one household appears under three names or one company has five service locations. Then it can materially change the answer.
Count completed paid work. A lead, estimate request, booked appointment, canceled job, or no-show is not a customer transaction yet. If an appointment later becomes a paid job, connect the records. Do not count the appointment itself as revenue.
Next, define "active." A maintenance business might classify a customer as active if they completed a paid job in the prior 24 months. Treat that as an example, not a commandment. A dental practice, elective treatment provider, annual inspection company, and one-time remodeling contractor will need different rules.
Choose an observation window too. A full 12 months can reduce seasonal distortion. An infrequent service may require several years of history. When your history is short, use a fixed realized window instead of pretending you know the full customer lifespan.
Hand your definition to someone else before you move on. If they would include and exclude the same records you would, the definition is specific enough to use.
2. Export and clean the inputs
Pull the data from the system closest to the money, meaning the one that records completed revenue. That may be accounting software, a point-of-sale system, practice-management software, field-service software, or a CRM tied to invoices.
For a transaction-based calculation, gather:
- completed revenue for the period;
- number of completed paid jobs or transactions;
- number of unique customers; and
- observed active lifespan, or the fixed cohort horizon you plan to measure.
You will derive average completed-job value and jobs per customer from the first three inputs. For a forecast, estimate active lifespan from mature customer groups with enough history to observe. When many customers are still active, their relationships have not ended. A simple average of the history recorded so far can understate lifespan. In that situation, report realized 12- or 24-month cohort value and wait for more data before making a longer forecast.
Refunds, credits, discounts, canceled work, duplicate customers, and test transactions are not spreadsheet housekeeping. Handle them consistently. Decide whether the exported amount is before or after discounts and refunds, then use that treatment throughout the analysis.
Reconcile the export with an accounting or production report. You may not get a penny-perfect match when older phone sales, cash payments, or duplicate records are involved. Do not hide the gap. Document it so nobody mistakes the result for cleaner data than you have.
Before using the totals, make sure they are close enough to the financial or production report. Record any unexplained difference as a limitation.
3. Calculate and label the result
Now calculate the two operating inputs:
Average completed-job value = completed revenue ÷ completed paid jobs
Average jobs per customer per period = completed paid jobs ÷ unique customers
Then multiply those figures by the average number of active periods:
Revenue LTV = average completed-job value × average jobs per customer per period × average active periods
Watch the units. If job frequency is measured per year and the customer remains active for an average of three years, the periods align. Mix monthly frequency with lifespan in years, though, and you will overstate the result unless you convert one of them.
Give the answer a label that includes both the measure and the window. "Three-year revenue LTV" tells you what you are looking at. "Customer value" leaves too much room for interpretation.
If you have a reliable gross-margin rate, calculate:
Gross-margin LTV = revenue LTV × gross-margin rate
Gross-margin LTV accounts for the direct delivery costs included in your margin calculation. Two customer groups can have the same revenue LTV and still produce different gross-margin LTV because their service mix and direct costs differ. Stripe's CLV guidance discusses purchase value, frequency, lifespan, and margin. Your own cost definitions still decide what the result includes.
Before you trust the answer, check that the units align and the label states revenue or margin plus the time horizon. Do not call gross-margin LTV net profit or contribution margin.
4. Validate the result with a cohort or segment
An overall average can look reassuring while hiding an important difference: customers who came in for a low-value one-off service are not the same as customers who started with work that naturally leads to maintenance or additional services.
A cohort is simply a group of customers who share a defined starting point, such as acquisition month, quarter, source, location, first service, or first offer. Compare your projected LTV with what those customers actually produce over 6, 12, 24, or another suitable number of months.
Instead of asking whether paid search customers have a good LTV in general, compare customers first acquired through paid search in the same quarter. Add the completed revenue or margin they produce during the chosen horizon, then divide by the number of acquired customers in that cohort. You can compare that result with another source only when the customer definition and horizon match.
Google Analytics 4 includes cohort exploration for grouping users by a shared characteristic and viewing behavior over time. It can help you investigate patterns, but GA4 is device-based. Its user count may not match customer records in your CRM or accounting system. Use invoice-linked records for the financial calculation whenever possible.
At this point, you should be able to name the cohort, the observation window, and whether the result is realized or forecast. If you cannot, the number needs a better label.
Worked example for a local service business
Take a fictional local service company. These numbers are an illustration, not YEAH! Local data or client data.
The company's clean records show:
- $450 average completed-job value;
- 1.6 completed jobs per customer per year;
- 3 average active years; and
- 55% gross-margin rate.
Start with three-year revenue LTV:
$450 × 1.6 × 3 = $2,160
That gives you $2,160 in three-year revenue LTV. It represents expected revenue under the stated assumptions. It is still revenue, not profit.
Now apply the gross-margin rate:
$2,160 × 0.55 = $1,188
That gives you $1,188 in three-year gross-margin LTV before CAC and overhead not included in gross margin.
Yes, that second label is a mouthful. It is long for a reason. Calling it "profit per customer" would imply that every relevant cost has been deducted, which the calculation does not establish.
The lifespan input should make you squint the hardest. If the business defines an active customer as someone with a completed paid job in the prior 24 months, it should use that rule across the dataset. When three years is based on a short history, a changing service mix, or delayed repeat work, treat $2,160 as a forecast to test, not a financial fact. Give the 55% margin the same scrutiny. An overall business margin may not describe the particular services or customers being evaluated.
The example checks the method. It says nothing about whether another service company will see the same frequency, lifespan, or margin.
Compare LTV with CAC without fooling yourself
Customer acquisition cost needs the same discipline. It is the average sales and marketing cost assigned to acquiring a new customer under a stated scope. The basic calculation is:
CAC = sales and marketing acquisition cost ÷ newly acquired customers
The numerator and denominator must describe the same period and customer population. If cost includes agency fees, ad spend, call tracking, software, and sales labor, do not divide that total by leads or booked appointments. Divide it by new customers who meet the paid-customer definition used in the LTV calculation.
Stripe distinguishes CAC, CAC payback, and the LTV-to-CAC relationship in its SaaS guidance. The definitions are useful, but a SaaS benchmark should not be turned into a universal target for dentists, roofers, home-service companies, or other local businesses.
Two rules keep this comparison honest:
- Match the scope by comparing the same source, cohort, geography, service category, and period where possible.
- Use a margin-aware LTV for an economics decision. Revenue LTV minus fully loaded CAC is not profit. Delivery costs and excluded overhead still matter.
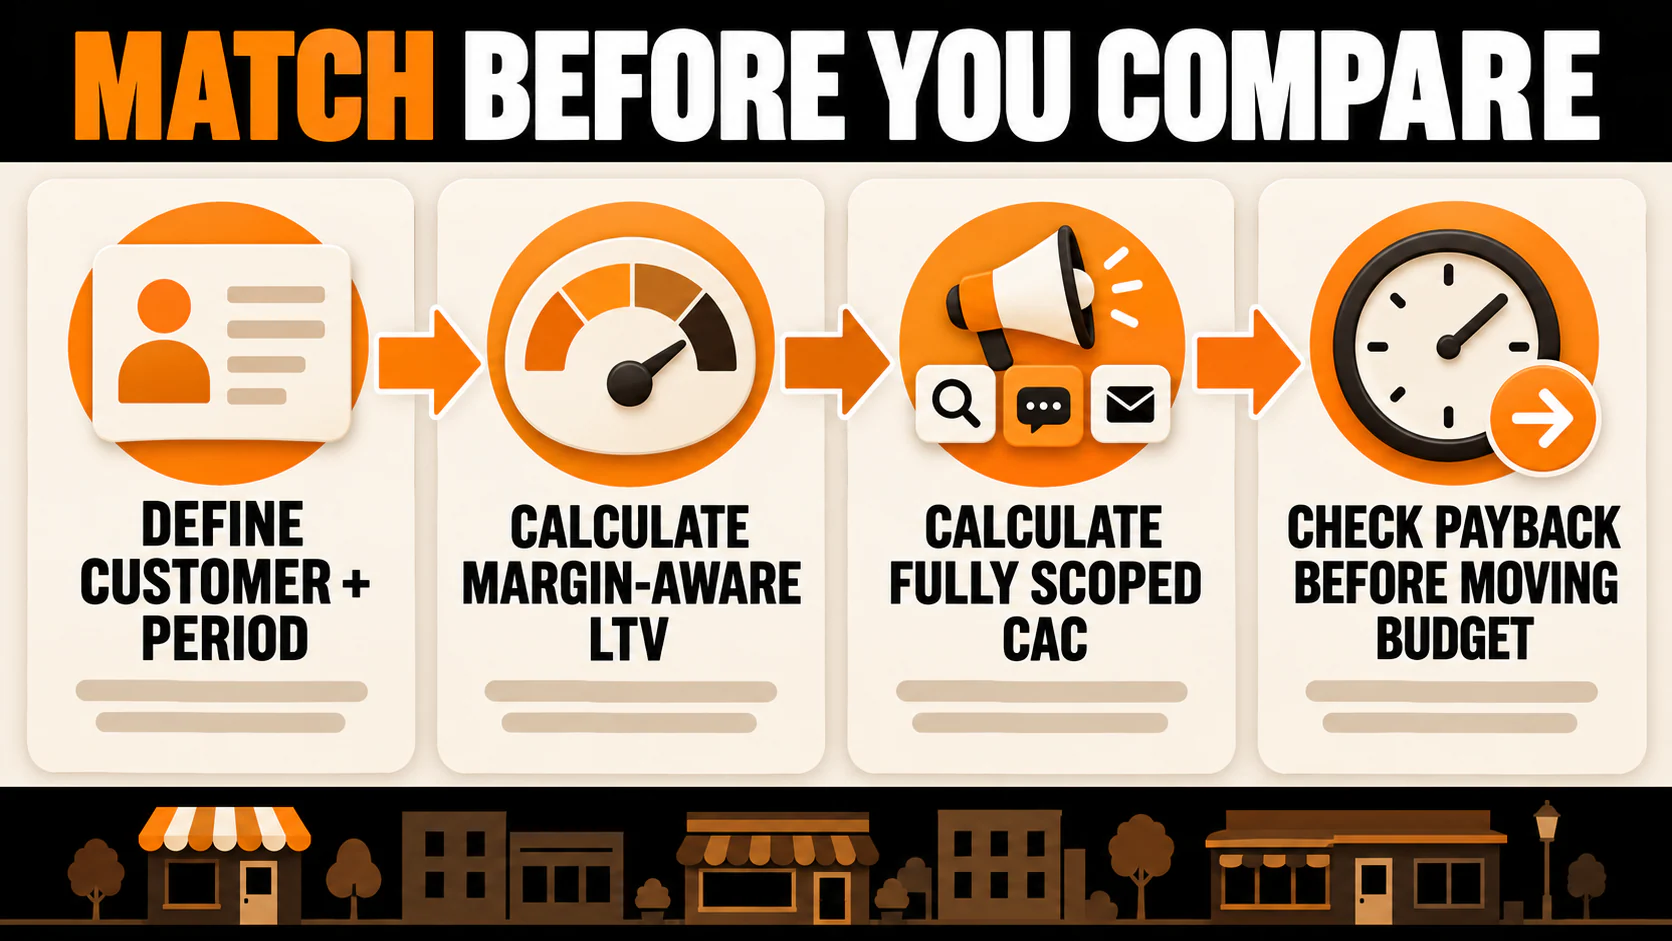
Check CAC payback too. It tells you how long the gross or contribution margin generated by the acquired customer takes to recover CAC. State which margin definition you use. Two sources may eventually produce the same LTV, but the source that recovers CAC later can create a different cash-flow burden. CAC payback and the LTV-to-CAC relationship answer related but different questions.
This is where attribution stops being marketing trivia and starts guiding money. You need to connect lead sources to revenue, not just form fills before a source-level LTV comparison can guide budget.
Where local-business LTV data goes wrong
Clean math cannot rescue muddled definitions. An LTV spreadsheet can be mathematically correct and still answer the wrong question.
| Data problem | Practical correction or limitation |
|---|---|
| Refunds, credits, and discounts are ignored | Use a consistent net or gross revenue definition and label it |
| Canceled jobs and no-shows count as customers | Count completed paid work and connect later payments to the original record |
| One household or account appears several times | Establish a deduplication rule before counting unique customers |
| Phone or offline sales have no acquisition source | Keep them in overall LTV, but label source-level comparisons incomplete |
| Prices or service mix changed materially | Segment by period or service instead of blending unlike revenue |
| Customer history is short | Use a fixed realized cohort horizon and avoid a long lifespan forecast |
| Multiple locations share one account | Decide whether the customer is the account or each serviced location |
| Most work is project-based | Measure realized value and referrals separately rather than assuming repeat frequency |
| The first conversion is an appointment | Do not count it as a paid customer until completed revenue exists |
Make every limitation visible before someone uses the number to move money. A polished spreadsheet is not the same thing as reliable data.
Use LTV to make the next decision
An overall LTV gives you a baseline. The useful decisions usually show up after you segment it.
Compare realized revenue and margin by acquisition source, first service, first offer, location, and acquisition cohort. The source producing the most leads may still bring in lower-value customers. A smaller source may produce customers who buy higher-margin services, return on a useful cadence, or recover CAC sooner. Test the records before you move the budget.
Then look at the operating levers you can observe. Service quality, timely appointment follow-up, a relevant maintenance reminder, an appropriate cross-sell, or cleaner customer matching may change future realized value. Do not assume any of them will work equally well in every business. Measure the cohort after the change.
Lead volume can fool you too. If you turn your website into a lead-generating asset, judge the result by completed customer value as well as inquiries and forms.
LTV earns its keep inside a compounding local growth system that connects acquisition, conversion, follow-up, and revenue measurement. Without those connections, the number is mostly a theory about an average customer.
Start with the overall revenue and gross-margin calculations. Then rerun them by cohort and acquisition source every quarter, or at a cadence that fits your sales cycle. Investigate material differences before you shift spend. And when the answer looks unusually precise but the definitions are loose, trust the discomfort. Fix the definitions first.
Last updated