

Key Takeaway
Learn how to read PageSpeed Insights, diagnose LCP, INP, and CLS problems, apply the right fixes, and verify real-user performance.
A red PageSpeed Insights score has a way of turning a website owner into a nervous mechanic. Compress this. Defer that. Install another plugin. Change the host. Then run the test again and hope the number turns green.
That is the wrong order.
A practical route is to start with real-user data when it is available, identify the failing Core Web Vital, and use the lab report to investigate the cause. Then make one controlled change, test the page's important functions, and measure again. The goal is a page that loads, responds, and stays visually stable for real visitors, not a perfect score collected under one simulated test.
A practical way to improve a PageSpeed Insights result
Use this priority order:
- Test one important page on mobile and desktop. A home page, high-traffic service page, or landing page is more useful than a page nobody visits.
- Read the field data first. If PageSpeed Insights has enough Chrome User Experience Report data, this section shows what actual Chrome users experienced over the previous 28 days.
- Name the problem. Is the page slow to show its main content (LCP), slow to respond after an interaction (INP), or shifting while it loads (CLS)? If field data is unavailable, use lab diagnostics to form a hypothesis without calling it a real-user verdict.
- Use lab diagnostics to find the likely cause. The Lighthouse report can expose slow server response, a late-discovered hero image, heavy JavaScript, layout shifts, and other fixable issues.
- Change and verify. Work on staging or keep a rollback path. Retest the same page under similar conditions, check forms and tracking, and then monitor field performance as new user data accumulates.
This order matters. A generic checklist can keep a developer busy while leaving the real bottleneck untouched.
How to read PageSpeed Insights before you change anything
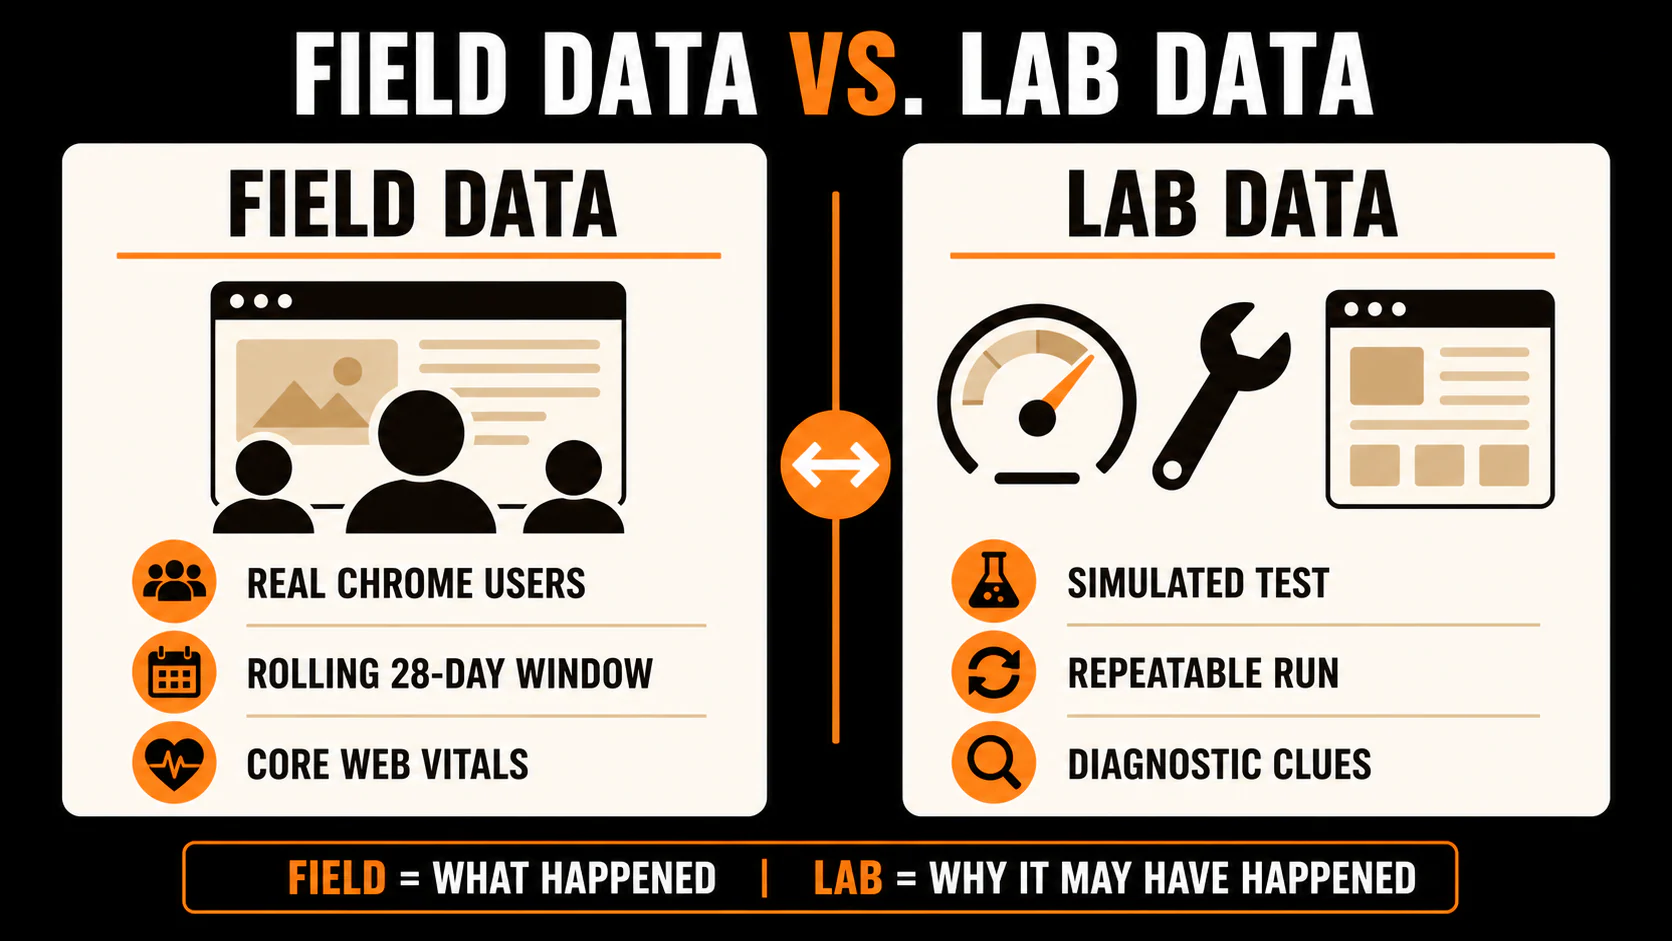
Google PageSpeed Insights puts two different types of evidence on one page. They answer different questions.
Field data shows what real Chrome users experienced
The field section comes from the Chrome User Experience Report, usually called CrUX. According to Google's PageSpeed Insights documentation, it summarizes real-user performance over a rolling 28-day period.
Field data is where you evaluate the current Core Web Vitals:
- Largest Contentful Paint (LCP) measures how long it takes the largest image, text block, or video visible in the viewport to render. A good result is 2.5 seconds or less.
- Interaction to Next Paint (INP) measures how quickly a page responds visually to user interactions across a visit. A good result is 200 milliseconds or less.
- Cumulative Layout Shift (CLS) measures unexpected movement in the page layout. A good result is 0.1 or less.
Those "good" thresholds are evaluated at the 75th percentile, as explained in the current Web Vitals guidance. In plain English, the 75th percentile of measured page loads must fall at or below the good threshold. Mobile and desktop measurements are evaluated separately.
Some URLs do not receive enough visits to show page-level field data. PSI may show data for the whole origin instead, or it may show no field data. That does not mean the page is fast or slow. It means this dataset cannot provide a page-level verdict.
Lab data is a controlled diagnostic test
The Lighthouse section loads the page in a simulated environment. It produces the familiar performance score and explains what affected that run.
Lab data is useful because it is available immediately and can be repeated after a change. It is not the same as field data. A Lighthouse performance score between 90 and 100 is classified as good, but a 100 is not required. The score also reflects lab metrics and weightings, not a direct replay of real visits. Chrome's Lighthouse scoring documentation explains the current calculation.
This distinction is especially important for responsiveness. Lighthouse reports Total Blocking Time (TBT), which can help reveal main-thread work that may contribute to poor responsiveness. It does not directly measure INP because a simulated page load does not reproduce the range of interactions collected from real users.
Mobile and desktop are separate tests
Do not blend the two scores into one conclusion. Mobile testing simulates a more constrained device and network. Desktop uses a different simulated setup and may uncover different bottlenecks. Start with the device mix that matters most to the page, but review both before approving a change.
Also expect some lab variation. Server load, third-party responses, and test conditions can change from one run to the next. Save several comparable runs rather than treating one number as permanent.
A report-first diagnostic workflow
Before touching code, save a baseline. Write down the URL, device, date, field Core Web Vitals status, Lighthouse score, and biggest diagnostics. A spreadsheet or ticket is plenty. You need a before-and-after record, not a new reporting hobby. If you are reviewing more than speed, fold this into a broader website audit checklist so performance fixes do not hide accessibility, tracking, or conversion problems.
Then follow the report:
- Choose a representative page. Test the exact URL that matters rather than limiting the check to the home page.
- Identify the failed field metric when field data is available. If URL-level data is unavailable, note whether PSI substituted origin data. Do not pretend origin data describes that one page exactly. If neither view is available, record that limitation and use lab diagnostics as a baseline without treating it as a Core Web Vitals pass or fail.
- Match the metric to its diagnostics. LCP points toward server response, resource discovery, images, and rendering delay. INP points toward JavaScript and main-thread work. CLS points toward missing space and late layout changes.
- Change one performance layer at a time. A batch of unrelated changes makes it harder to tell what helped and harder to find what broke.
- Run functional checks. Test navigation, forms, phone links, booking tools, checkout, consent controls, analytics, and advertising conversion tracking.
- Repeat the lab test. Compare several runs under similar conditions.
- Monitor field performance. CrUX needs new visits and time. Search Console or real-user monitoring can provide a broader view while the rolling field window updates.
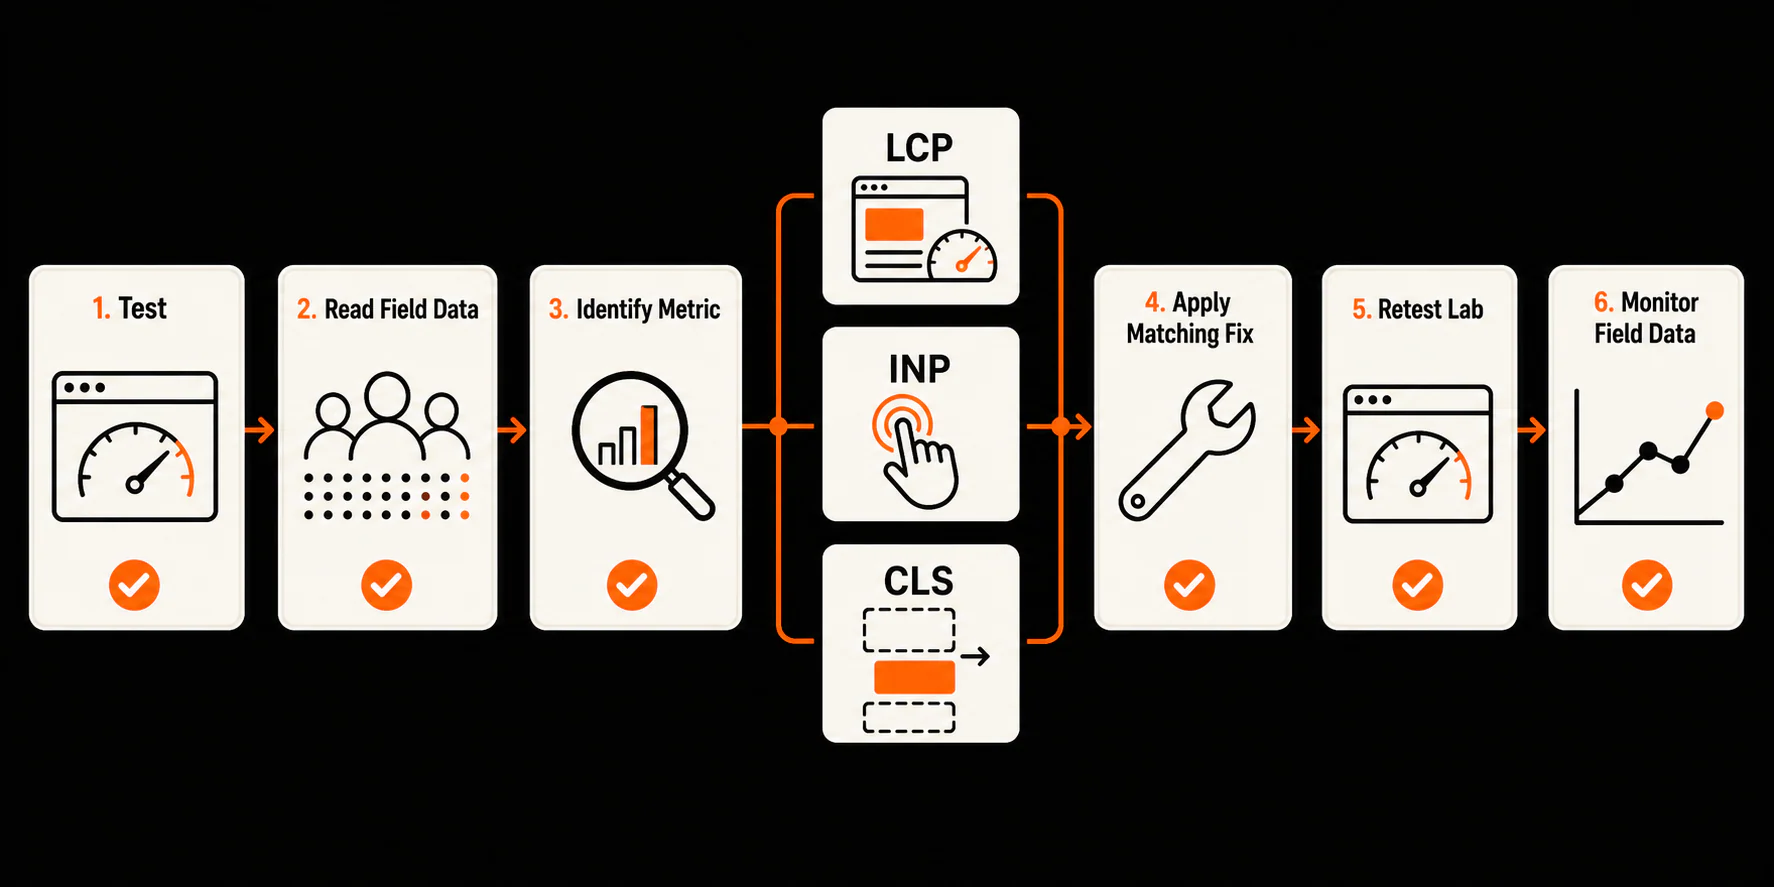
A costly failure in performance work is skipping step three. If CLS is poor, compressing the hero image may reduce transfer size while doing nothing about the missing image dimensions that caused the page to jump.
How to fix poor LCP
LCP is about when the main visible content renders. On a local business page, the LCP element is often a hero image, heading block, or large banner. Confirm the actual LCP element in the PSI diagnostics or Chrome DevTools before optimizing it.
Google breaks LCP into four parts: time to first byte, resource load delay, resource load duration, and element render delay. Its LCP optimization guidance gives you a better work order than changing compression settings at random and hoping the score moves.
Improve time to first byte
Time to First Byte (TTFB) measures how long the browser waits for the first byte of the response. A slow backend leaves every later resource waiting.
Check for:
- Slow application or database work.
- Pages that cannot use full-page caching when they safely could.
- An overloaded or poorly configured server.
- Excessive middleware, security checks, or personalization before the response begins.
- Redirect chains before the final page loads.
A CDN can help when it serves cacheable content from an edge location closer to the visitor. It cannot repair a slow database query or an origin that prevents useful caching. Use the TTFB optimization guide to separate network delay from backend work.
Make the LCP resource discoverable early
The browser cannot download a hero image it has not discovered. An LCP image loaded only after JavaScript runs, inserted through a late CSS background, or hidden behind another request starts at a disadvantage.
Prefer an image the browser can discover in the initial HTML when the design allows it. Do not lazy-load the likely LCP image. Lazy loading is useful for offscreen media, but delaying the main above-the-fold visual works against LCP.
You can selectively apply fetchpriority="high" to the confirmed LCP image when the browser would otherwise prioritize it too late. Do not mark a page full of images as high priority; priority hints are useful only when they communicate a real order.
Send an appropriately sized image
Do not send a 4,000-pixel photo to a 700-pixel container. Generate responsive image candidates and let the browser select an appropriate size. Compare WebP or AVIF with the original format at a visually acceptable quality rather than assuming one format always wins.
Compression, dimensions, and format all matter, but the output should still look credible. A soft, artifact-filled hero is not a performance victory.
Reduce render delay
An image can finish downloading and still wait to appear. Large stylesheets, web fonts, client-side rendering, and synchronous JavaScript may delay the final paint.
Remove code the page does not need, load noncritical work later, and keep essential above-the-fold styles available early. Font changes need care: an aggressive font workaround can trade an LCP improvement for visible text movement or a broken brand treatment.
How to fix poor INP
INP replaced First Input Delay as a Core Web Vital. FID observed only the delay before the browser began handling the first interaction. INP evaluates the latency of interactions throughout the visit and includes the time until the next visual update. That makes it a better signal for pages that seem loaded but respond sluggishly when someone opens a menu, uses a form, or taps a filter.
Start with JavaScript and third-party code. A page can look loaded while still feeling sluggish because the browser is busy. The official INP optimization guidance recommends finding slow interactions, reducing CPU work, and giving the browser time to render the update.
Remove work that has no clear purpose
List every tag, widget, chat tool, heatmap, video embed, form enhancer, and advertising script on the page. Ask what business or user job it performs. Remove duplicates and tools that no longer justify their cost.
This is more useful than counting scripts or plugins. One poorly behaved widget can create more main-thread work than several lightweight components.
Break up long main-thread tasks
JavaScript runs on the browser's main thread, which also handles user input and rendering. A long task can leave an interaction waiting.
A developer can split large tasks, defer noncritical work, load code only where it is needed, and yield between chunks so the browser can respond. Expensive event handlers should do the minimum immediate work required, then move secondary work out of the interaction's critical path.
TBT in Lighthouse can help locate long blocking work during page load. Use it as a clue, not as a substitute for field INP. Poor INP may occur after load, during an interaction that the lab run never performs.
Treat third-party code as part of the page
You may not control a third-party script's internals, but you control whether it loads, where it loads, and when it becomes active. A booking tool may be essential. Several overlapping tracking tools may not justify their combined cost.
Delay nonessential embeds until a user requests them, use a lightweight placeholder for video or maps where appropriate, and restrict scripts to pages that need them. After any change, verify analytics and lead tracking. A faster page with missing conversion data creates a different problem.
How to fix poor CLS
CLS is the metric readers notice when they try to tap a button and the page moves. It measures visual stability by tracking unexpected layout shifts.
A strong first check is whether the page reserves space before an element loads.
- Add accurate
widthandheightattributes or an aspect ratio for images and video. - Reserve a stable container for maps, forms, review widgets, ads, and other embeds.
- Give banners and notices a defined place instead of inserting them above existing content after load.
- Avoid injecting a promotion or consent element that pushes the entire page down.
Fonts can also move text when a fallback face and web font have different dimensions. Review font loading, use a compatible fallback, and limit unnecessary font families and weights. The aim is a controlled transition, not hiding text for an extended period.
For animation, prefer effects that use transform rather than changing layout properties such as top, left, width, or height. Google's CLS optimization guide covers both load-time shifts and shifts that happen later in the page lifecycle.
Retest more than the first screen. A late-loading review carousel or booking widget can create a shift after the initial Lighthouse capture.
Fix site-wide delivery bottlenecks
Caching, compression, CDN delivery, and hosting changes can help across the site. They are not automatic wins. Confirm the bottleneck first, then roll out changes with a clear rollback path.
Caching
Browser caching lets returning visitors reuse resources instead of downloading unchanged files again. Server or full-page caching can reduce backend work for suitable pages. Configure cache rules around how content changes, and use versioned filenames or another reliable invalidation method so visitors do not receive stale CSS or JavaScript after a release.
Do not cache personalized, account, cart, or form responses blindly. Test the actual page behavior.
Compression
Gzip or Brotli can reduce the transfer size of HTML, CSS, JavaScript, SVG, and other text-based files. Verify compression in the response headers or browser network panel. Image compression is a separate process; turning on Brotli does not resize a photo.
CDN delivery
A content delivery network may shorten the trip between a visitor and cacheable resources. Modern CDN services may also provide edge caching, compression, and newer transport protocols. The benefit depends on the audience, cache configuration, and origin behavior.
Confirm that the CDN is serving the intended files and that cache invalidation works before expanding the rollout. A misconfigured cache can preserve old assets or interfere with dynamic pages.
Hosting and backend performance
Hosting becomes a likely factor when TTFB remains poor after redirect and caching checks, or when server response degrades under ordinary load. Before migrating, gather evidence. Look at application timing, database work, CPU or memory pressure, cache hit rates, and geographic distance to the audience.
A new host can change infrastructure. It does not automatically fix inefficient application code or a heavy front end.
Redirects
Redirects are sometimes necessary, especially when URLs change. The performance problem is the chain: URL A sends the browser to B, which sends it to C.
Update internal links to the final canonical destination and collapse unnecessary hops. Keep required redirects for users and search engines; do not remove them only to shave a small amount from a lab test.
A compact WordPress page-speed workflow
WordPress makes speed work accessible, and it makes it easy to pile on overlapping optimization tools. That can create fragile results. Make a current backup and use staging, or keep a reliable rollback path, before you change anything.
Then:
- Profile the page. Use PSI, browser developer tools, host diagnostics, or a trusted performance profiler to identify slow requests, heavy scripts, and backend work.
- Review the theme, plugins, and third parties by workload. Do not target an arbitrary plugin count. Find duplicate features, unused plugins, scripts loading on every page, and components tied to the failed metric.
- Choose one compatible optimization stack. Stacking several caching, minification, lazy-loading, and script-delay plugins can duplicate work or break dependencies.
- Change one feature at a time. Test cache settings, image handling, CSS delivery, and JavaScript delay separately when possible.
- Check the business functions. Submit forms, tap phone buttons, open menus, complete bookings or purchases, verify consent behavior, and confirm analytics and ad conversions.
- Deploy with a rollback path. Clear the correct cache layers and check the live page from a logged-out browser.
Performance requirements are easier to meet when they enter the project before launch. The same principle applies to making web design and SEO work together: define acceptance checks during planning and development, not after every template is already built.
How to verify the improvement
An immediate Lighthouse improvement and a real-user improvement are related, but they are not interchangeable.
For the lab check:
- Test the same URL and device setting.
- Run the test several times and compare the middle result rather than the best score.
- Confirm the targeted diagnostic improved.
- Check that another vital did not regress.
- Repeat the functional tests that matter to the page.
For the field check:
- Watch PSI as the rolling CrUX window updates.
- Use the Core Web Vitals report in Google Search Console to monitor groups of similar URLs.
- Use real-user monitoring if you need faster, page-specific detail or want to segment by template, device, geography, or release.
- Record the deployment date so you can compare the periods honestly.
Put a lightweight regression check into every future release. One new chat widget, hero video, review embed, or tag-manager rule can quietly undo months of careful performance work. If a developer or agency owns the site, make LCP, INP, CLS, and functional tests part of the handoff.
PageSpeed Insights FAQ
Do I need a 100 PageSpeed score?
No. A Lighthouse performance score between 90 and 100 is classified as good, but 100 is not a business requirement and does not prove that real users pass Core Web Vitals. Prioritize verified user problems and material bottlenecks over the last few lab points.
Why does my PageSpeed score change between tests?
Lighthouse is a simulated run. Server load, third-party responses, dynamic content, and test conditions can vary. Compare several tests under similar conditions and look for a consistent change in the targeted metric or diagnostic.
Does improving Core Web Vitals improve SEO?
Google says Core Web Vitals are used by its ranking systems, but page experience involves more than Core Web Vitals, and no single metric guarantees a ranking change. Improve performance because it makes the page more usable and removes a technical weakness; measure search results separately.
Should I optimize mobile or desktop first?
Review both. Prioritize the device your audience uses and the version with the more serious real-user problem. A local service page may receive mostly mobile visits, but that should come from analytics rather than assumption.
What if PageSpeed Insights has no field data?
Use the Lighthouse report as a diagnostic baseline, check whether PSI offers origin-level data, and consider real-user monitoring if the page matters enough. "No data" means the CrUX dataset cannot provide that view; it is not a passing result.
Fix the largest verified bottleneck first
Page speed work becomes manageable once the report is treated as a decision tool instead of a grade. Find the failing metric, confirm the likely cause, make a controlled change, and verify both performance and function.
Start with the page that matters most and the bottleneck that has the strongest evidence. If the diagnosis reaches into templates, rendering, tracking, or crawlability, YEAH! Local can help with the broader technical and local SEO work around it. A page that behaves better for the people trying to use it is more useful than a screenshot of 100.
Last updated